DigiMEDSPA EMR
 DigiMEDSPA CONNECT ™
View Patient’s Vitals Graph
This user guide explains how to view a patient’s vitals graph within the DigiMEDSPA Portal. It helps you quickly interpret trends and changes in key health indicators over time.
Understanding Terminologies
Patient’s Vitals Graph
A patient’s vitals graph is a visual chart that displays a patient’s key vital signs, such as heart rate, blood pressure, temperature, and oxygen saturation over a selected period of time. It helps providers easily track trends, identify changes, and make informed decisions about the patient’s health status.
Access this link: https://digimedspa.com/ap2/treatmentplantemplates
View Patient’s Vitals Graph
- The user can view the patient's vitals graph through the Patient Profile by accessing Patients List Screen from two entry points.
- From the EMR Board Tabs, click on ‘’Patients.’’

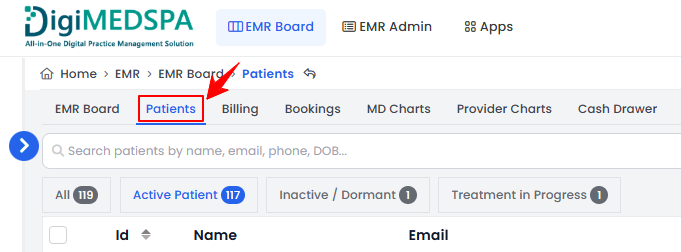
- From the Left Navigation, click on the “EMR Board” dropdown menu and select “Patients.’’ Alternatively, you can type “Patients” into the search bar in the Left Navigation.
- From the EMR Board Tabs, click on ‘’Patients.’’
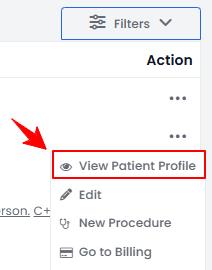
- To view a specific patient from the list, click the three dots under the action column and select "View Patient Profile," or simply click anywhere on the patient’s data.
- On the Patient Information Screen, users can find a detailed overview of the patient’s information. To view the vitals, click on the “Vitals” tab.
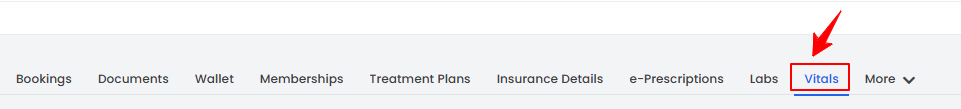 Note: From the EMR Board, go to the bookings listed under the “Checked In” step and click the “Vitals” button. You will be taken directly to the Vitals tab in the patient profile.
 - To view a patient's vitals graph, click on the “View Graphs” button under the Quick Actions menu on the left side of the screen.
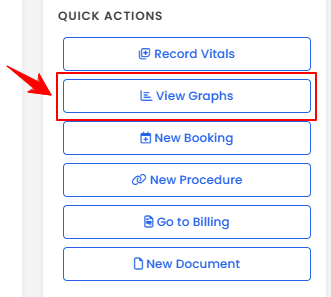
- Here, you can view visual trends for weight, BMI, body fat %, oxygen saturation, blood pressure, and temperature to quickly track changes in the patient’s health.
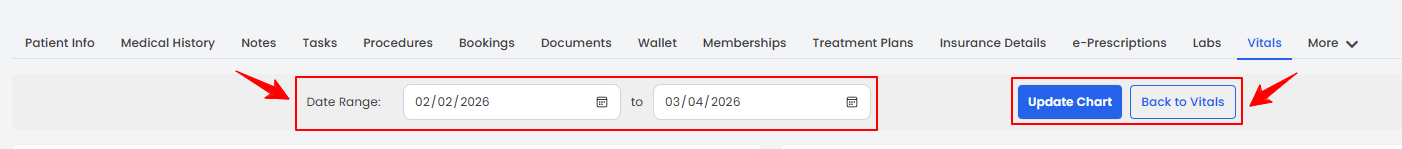
- Adjust the date range at the top to choose the time period for viewing the patient’s vital trends. Click “Update Chart” to refresh the graphs or “Back to Vitals” to return to the Vitals tab.