DigiMEDSPA EMR
 DigiMEDSPA CONNECT ™
How to Review Service Revenue by Location?
This user guide explains how to review service revenue by location, helping users clearly compare performance across different sites, identify top- and under-performing locations, and make more informed business decisions.
Understanding Terminologies
Service Revenue
Service revenue refers to the total income generated from treatments and procedures provided to patients.
Location
Location refers to the specific physical branch or clinic where services are delivered. Each location represents an individual facility, allowing the clinics to track and compare service revenue across different branches.
Review Service Revenue by Location
- The user can review service revenue by location by accessing the “Location Reports” through Reports from two entry points.
- From the EMR Admin, click on “Location Reports” under “Reports.”

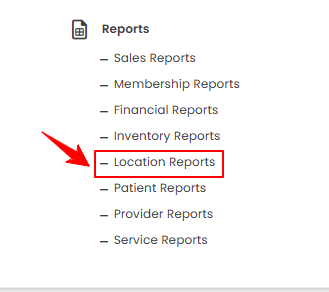
- From the Left Navigation, open the “EMR Admin” dropdown, select “Reports,” and then choose “Location Reports” from the subsequent dropdown menu. Alternatively, you can type “Location Reports” into the search bar in the Left Navigation.
- From the EMR Admin, click on “Location Reports” under “Reports.”
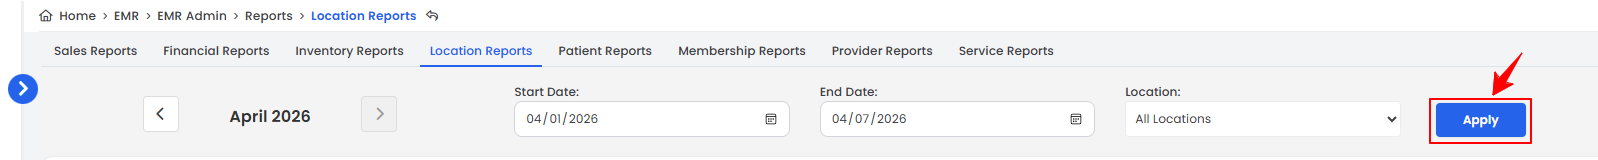
- The Service by Location tab opens by default. To view the service revenue by location, set the Start and End Dates, select the Location, and then click “Apply” to filter the data for the specified period.
- At the top of the screen, key metrics for the selected period are displayed, including Total Service Revenue, Active Locations, Top Service, and Unique Services.
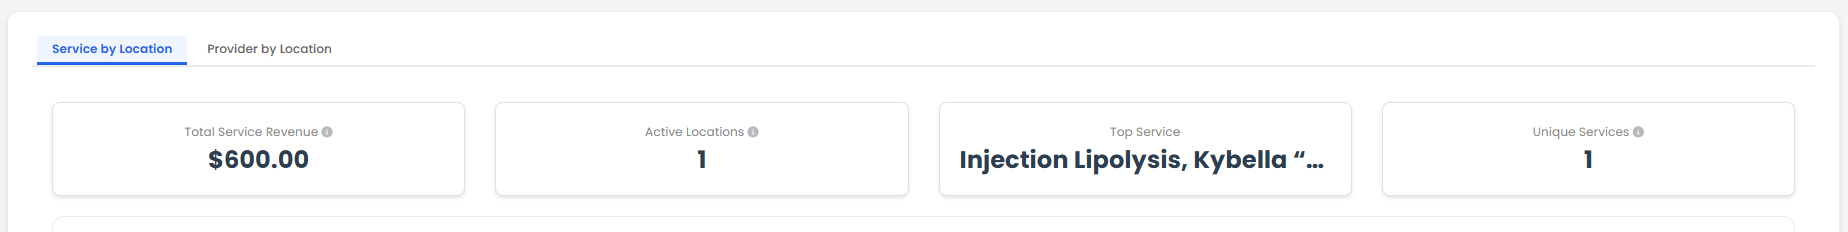 Note: “Total Service Revenue” is the overall income generated from all services provided across the Med Spa, including treatments like facials, injectables, laser procedures, and body contouring. “Active Locations” refers to the number of Med SPA branches or clinics currently open and providing services to patients. “Top Service” is the specific treatment or procedure that generates the highest revenue or is most popular among patients at a location or across the Med SPA. “Unique Services” refers to the total number of distinct treatments or procedures offered by the Med SPA, excluding duplicates, showing the variety of services available to patients.
 - Review the bar graph for Service Revenue by Location.
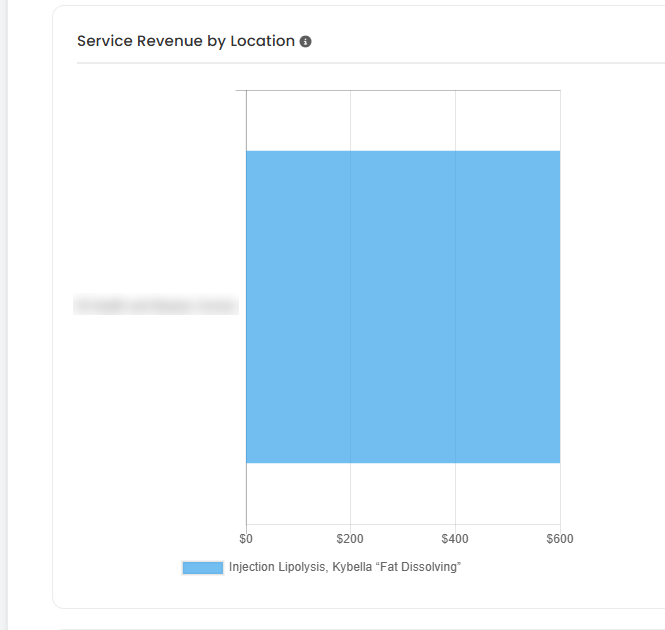
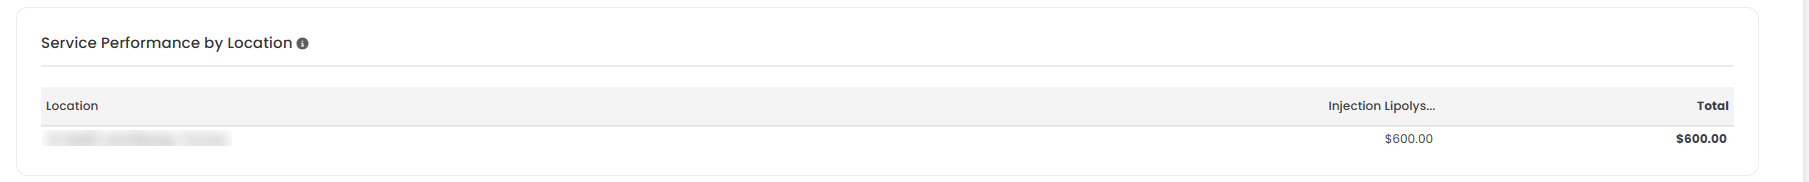
- Below the bar graphs, you’ll find a detailed breakdown of Service Performance by Location.