

 DigiMEDSPA EMR
 DigiMEDSPA CONNECT ™
How to Review Sales Reports?
This user guide explains how to review sales reports in the portal. It helps users access, filter, and analyze sales data to track performance, monitor revenue, and make informed business decisions.
Understanding Terminologies
Sales Report
A sales report is a document or digital record that summarizes a clinic’s sales activities over a specific period. It provides detailed information on revenue, products or services sold, sales trends, patient purchases, and performance metrics, helping clinics track progress, identify opportunities, and make informed decisions.
Access this link: https://digimedspa.com/ap2/treatmentplantemplates
Review Sales Reports
- The user can review sales reports by accessing the “Sales Reports” through Reports from two entry points.
- From the EMR Admin, click on “Sales Reports” under “Reports.”

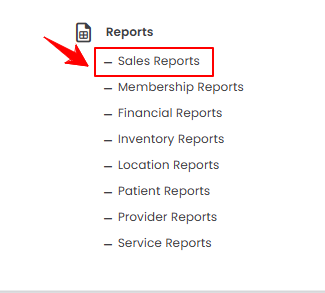
- From the Left Navigation, open the “EMR Admin” dropdown, select “Reports,” and then choose “Sales Reports” from the subsequent dropdown menu. Alternatively, you can type “Sales Reports” into the search bar in the Left Navigation.
- From the EMR Admin, click on “Sales Reports” under “Reports.”
- The Revenue Overview tab opens by default. To view sales reports, set the Start and End Dates, select the Location, and then click “Apply” to filter the data for the specified period.

- Drag and drop the services to arrange them in your preferred order. Once a service is moved to the desired position, the new order is automatically saved.
- At the top of the screen, key metrics for the selected period are displayed, including Total Sales Revenue, Total Transactions, Average Transaction Value, and Revenue Growth Compared to the Previous Period.
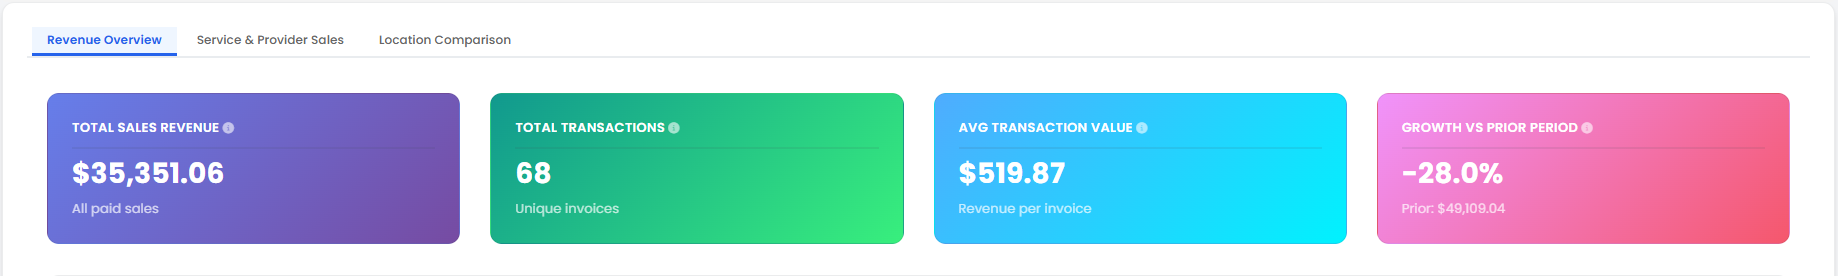 Note: “Total Sales Revenue” is the total dollar amount from all paid items, including services, products, memberships, and gift cards during the selected period. “Total Transactions” refers to the total number of unique invoices created within that period. “Average Transaction Value” represents the average dollar amount per invoice. “Growth vs Prior Period” shows the percentage change in total revenue compared to the same duration immediately preceding the selected dates.
 - Review the bar graphs of Revenue by Sales Category and Monthly Revenue Trend.
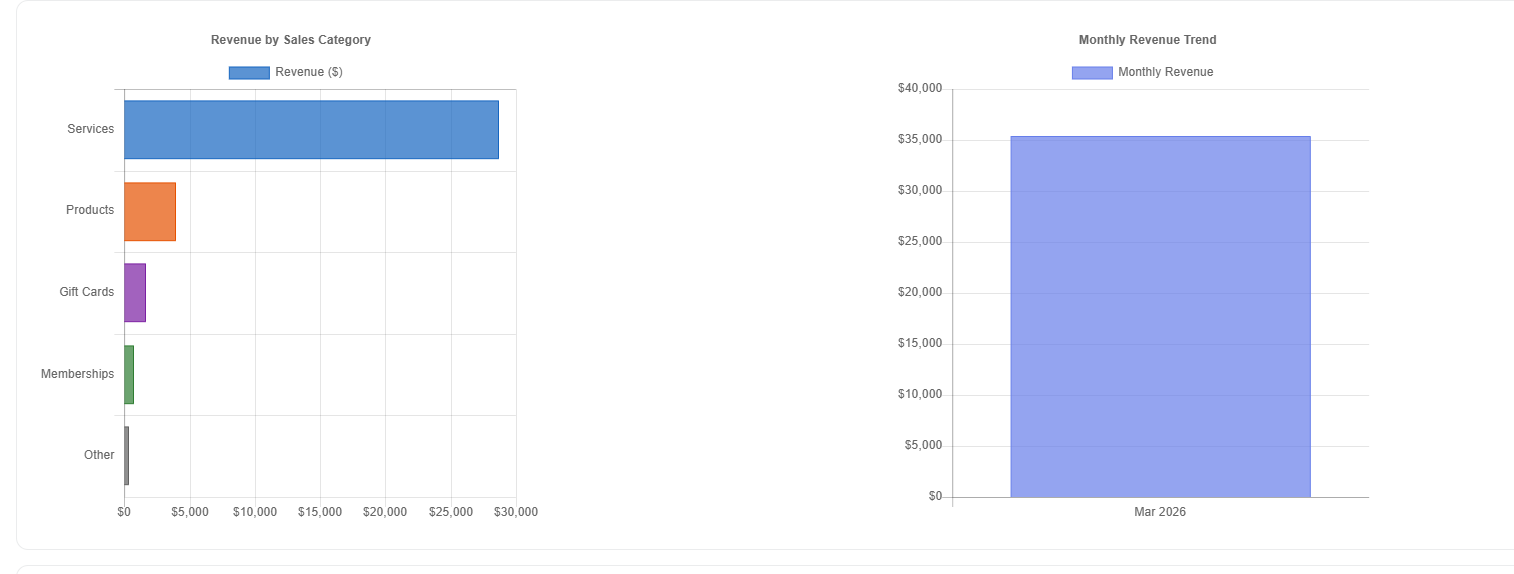 Note: “Revenue by Sales Category” shows the total revenue generated from each type of sale, such as treatments, products, memberships, or gift cards, allowing you to see which categories contribute most to your Med SPA’s income. “Monthly Revenue Trend” displays the revenue earned each month over a period, helping you track patterns, seasonal fluctuations, and overall business growth.
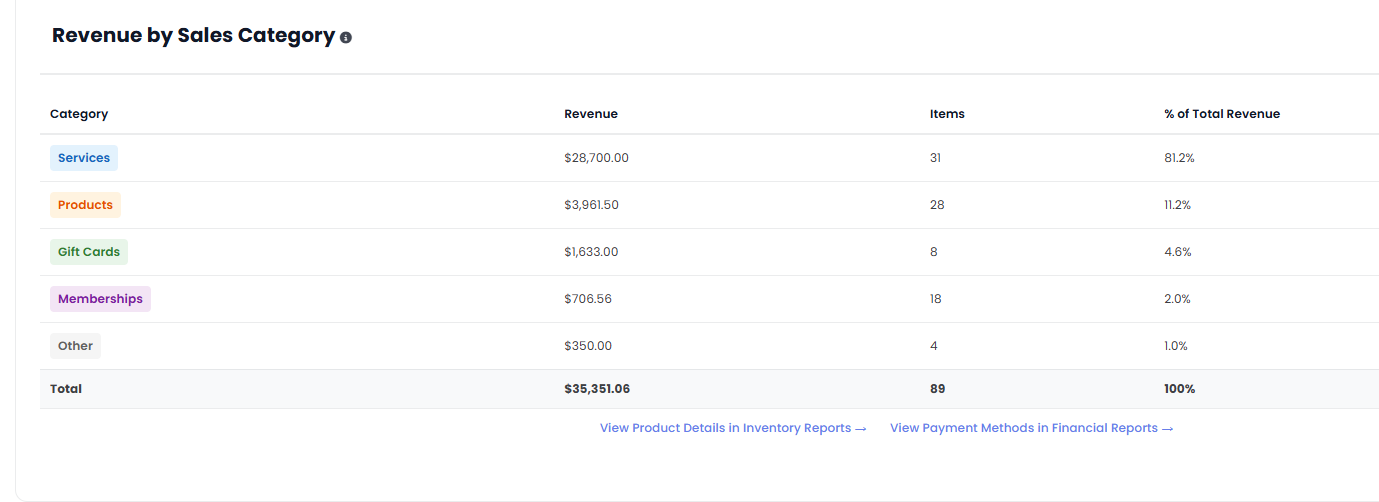
 - Below the bar graphs, you’ll find a detailed breakdown of Revenue by Sales Category, including the revenue amount, number of items sold, and percentage of total revenue for each category.
 Note: For a clear understanding of service and provider sales reports, refer to “How to Review Service and Provider Sales Report?” For insights on comparing sales performance across multiple locations, see “How to Compare Sales Across Locations?”