DigiMEDSPA EMR
 DigiMEDSPA CONNECT ™
How to Review Revenue by Product Type & Category in Inventory Reports?
This user guide explains how to review revenue by product type and category within inventory reports, helping you understand which products are driving sales and profitability.
Understanding Terminologies
Revenue by Product Type and Category
Revenue by product type and category refers to the total income generated from sales, organized based on different product types (such as services, retail items, or packages) and specific categories within those types (like skincare, injectables, or devices). This breakdown helps clinics track which segments contribute most to overall revenue, enabling better decision-making in pricing, inventory management, and sales strategies.
Review Revenue by Product Type & Category in Inventory Reports
- The user can review revenue by product type and category by accessing the “Inventory Reports” through Reports from two entry points.
- From the EMR Admin, click on “Inventory Reports” under “Reports.”

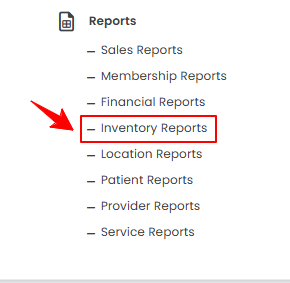
- From the Left Navigation, open the “EMR Admin” dropdown, select “Reports,” and then choose “Inventory Reports” from the subsequent dropdown menu. Alternatively, you can type “Inventory Reports” into the search bar in the Left Navigation.
- From the EMR Admin, click on “Inventory Reports” under “Reports.”
- The Revenue by Type & Category tab opens by default. To view revenue by product type and category, set the Start and End Dates, select the Location, Product Type and Category from the dropdown menus, and then click “Apply” to filter the data for the specified period.

- At the top of the screen, key metrics for the selected period are displayed, including Total Product Revenue, Total Units Sold, Total Cogs, and Gross Margin.
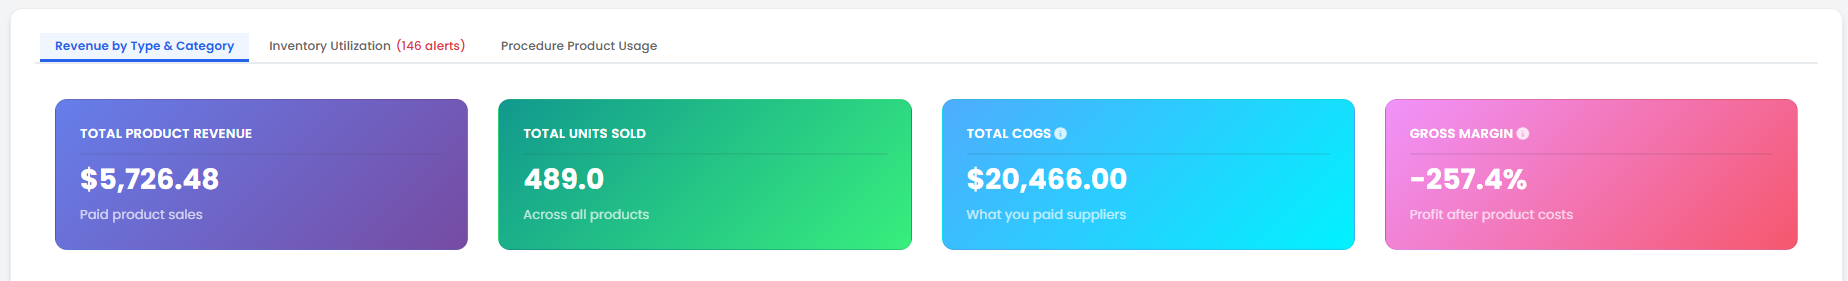 Note: “Total Product Revenue” is the total amount of money generated from selling products before deducting any expenses, discounts, or costs. “Total Units Sold” is the total number of individual product items sold during a specific time period. “Total COGS (Cost of Goods Sold)” is the direct cost incurred to produce or purchase the products that were sold, including materials, manufacturing, or wholesale costs. “Gross Margin” is the difference between total product revenue and total COGS, representing the profit earned from product sales before operating expenses are deducted.
 - Review the bar graphs of Revenue by Product Type and Category.
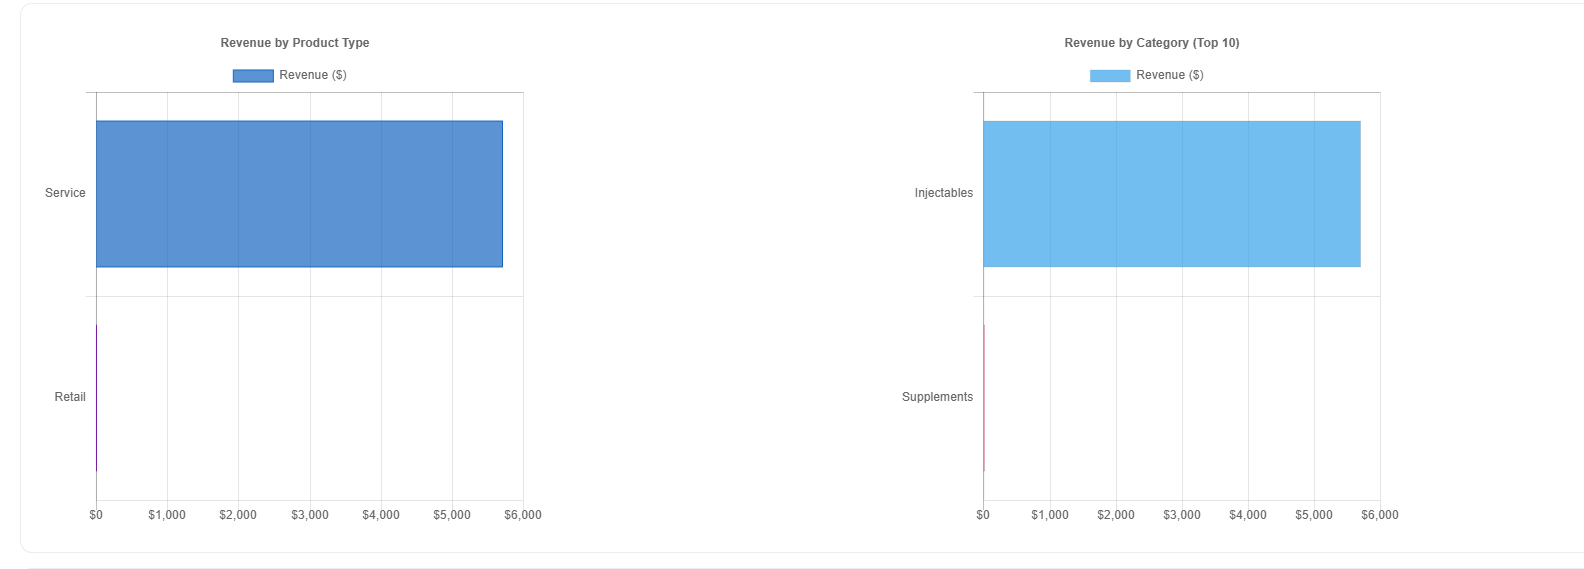
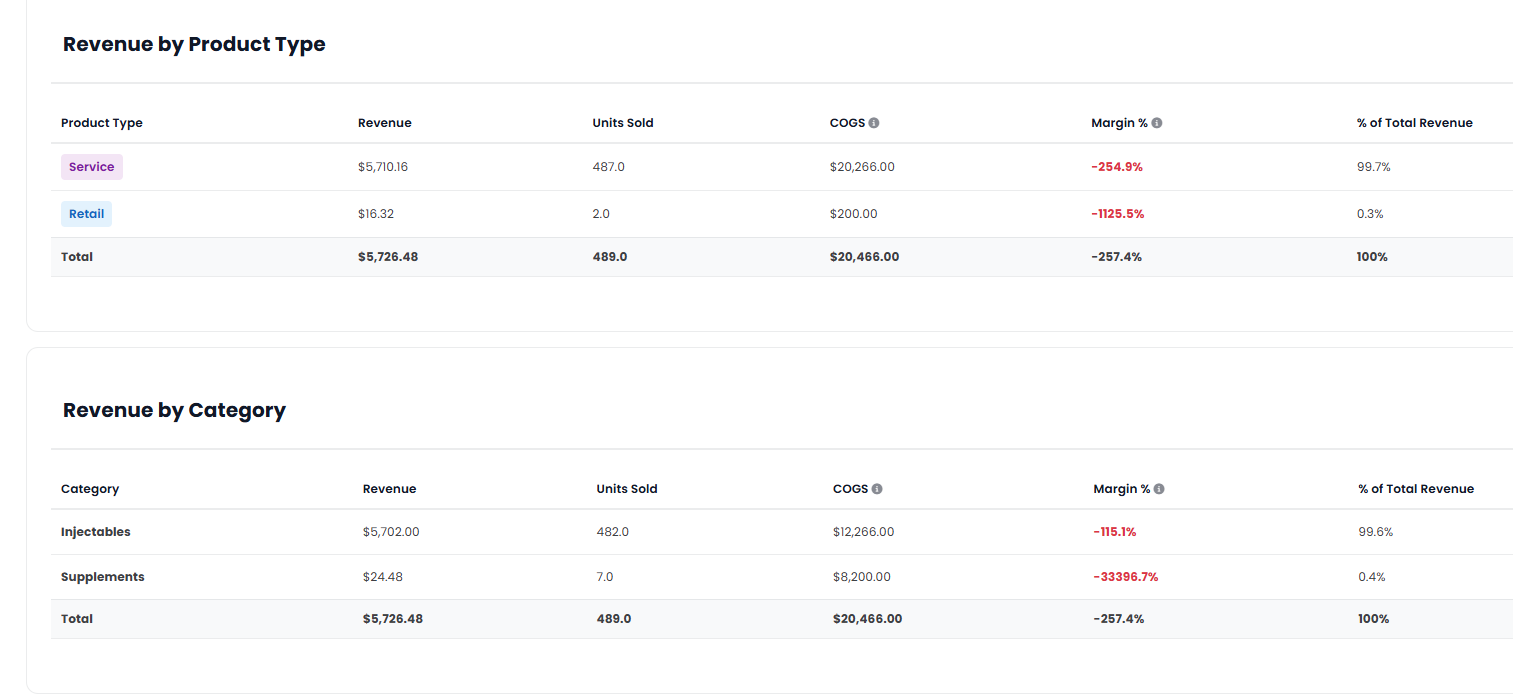
- Below the bar graphs, you’ll find a detailed breakdown of Revenue by Product Type and Revenue by Category, including revenue, units sold, COGS, margin percentage, and percentage of total revenue.
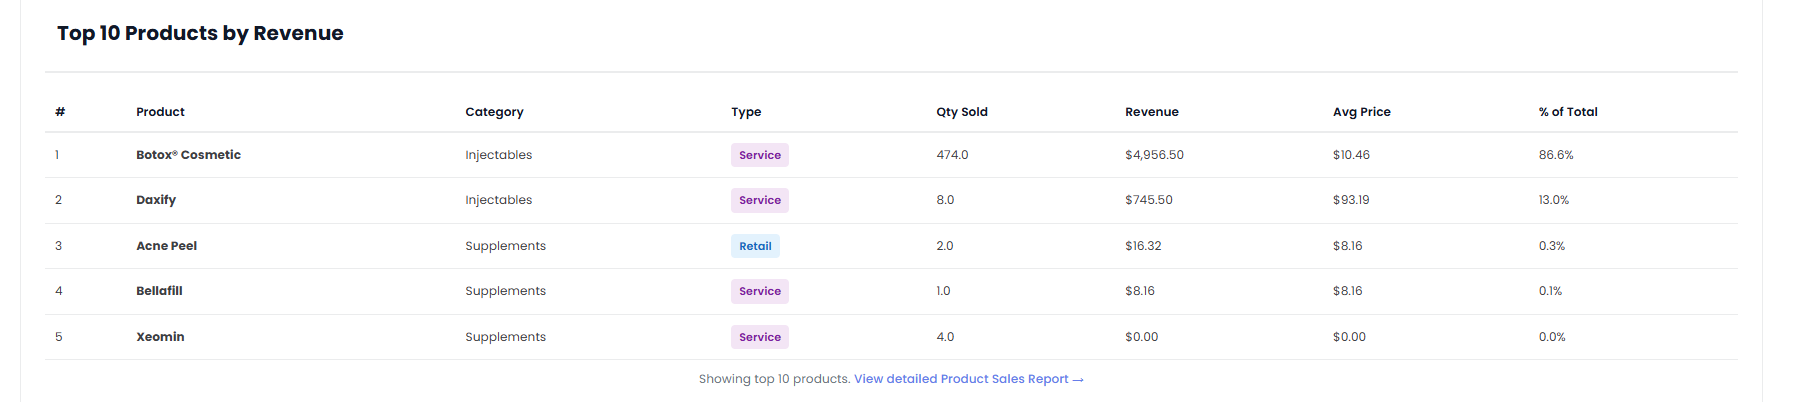
- Review the Top 10 Products by Revenue, including each product’s category, type, quantity sold, total revenue, average price, and percentage of overall revenue.