DigiMEDSPA EMR
 DigiMEDSPA CONNECT ™
How to Review Revenue Breakdown in Financial Reports?
This user guide explains how to review revenue breakdown in financial reports, providing details by invoice type and tracking daily revenue trends to help identify patterns, monitor performance, and ensure accurate financial reporting.
Understanding Terminologies
Revenue Breakdown
Revenue breakdown is the detailed analysis of a clinic’s income, showing how revenue is distributed across different sources, such as invoice types, products, services, or memberships, to provide insights into performance and trends.
Access this link: https://digimedspa.com/ap2/treatmentplantemplates
Review Revenue Breakdown in Financial Reports
- The user can review revenue breakdown by accessing the “Financial Reports” through Reports from two entry points.
- From the EMR Admin, click on “Financial Reports” under “Reports.”

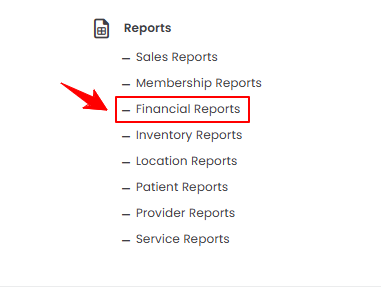
- From the Left Navigation, open the “EMR Admin” dropdown, select “Reports,” and then choose “Financial Reports” from the subsequent dropdown menu. Alternatively, you can type “Financial Reports” into the search bar in the Left Navigation.
- From the EMR Admin, click on “Financial Reports” under “Reports.”
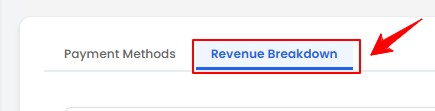
- The Payment Methods tab opens by default. To view the revenue breakdown, click on the “Revenue Breakdown” tab.
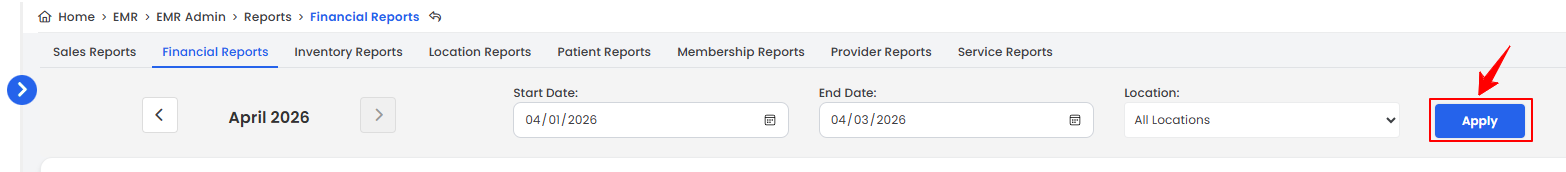
- To view the revenue breakdown report, set the Start and End Dates, select the Location, and then click “Apply” to filter the data for the specified period.
- At the top of the screen, key metrics for the selected period are displayed, including Total Revenue, Total Invoices, Average per Invoice, and Top Invoice Type.
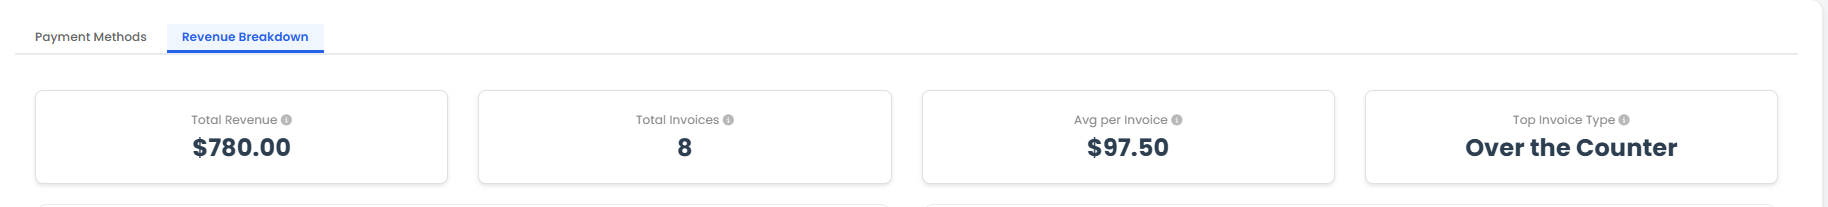 Note: “Total Revenue” is the overall income earned from all paid line items (services, products, memberships) during a specific period. “Total Invoices” is the total number of invoices issued to patients within a given timeframe. “Average per Invoice” is the average revenue generated per invoice, calculated by dividing total revenue by the total number of invoices. “Top Invoice Type” is the invoice category (e.g., over the counter, booking, membership) that contributes the highest revenue or occurs most frequently.
 - Review the Revenue by Invoice Type and Revenue by Line Item Category pie charts, along with the Daily Revenue Trend bar graph, to understand revenue distribution and track daily performance.
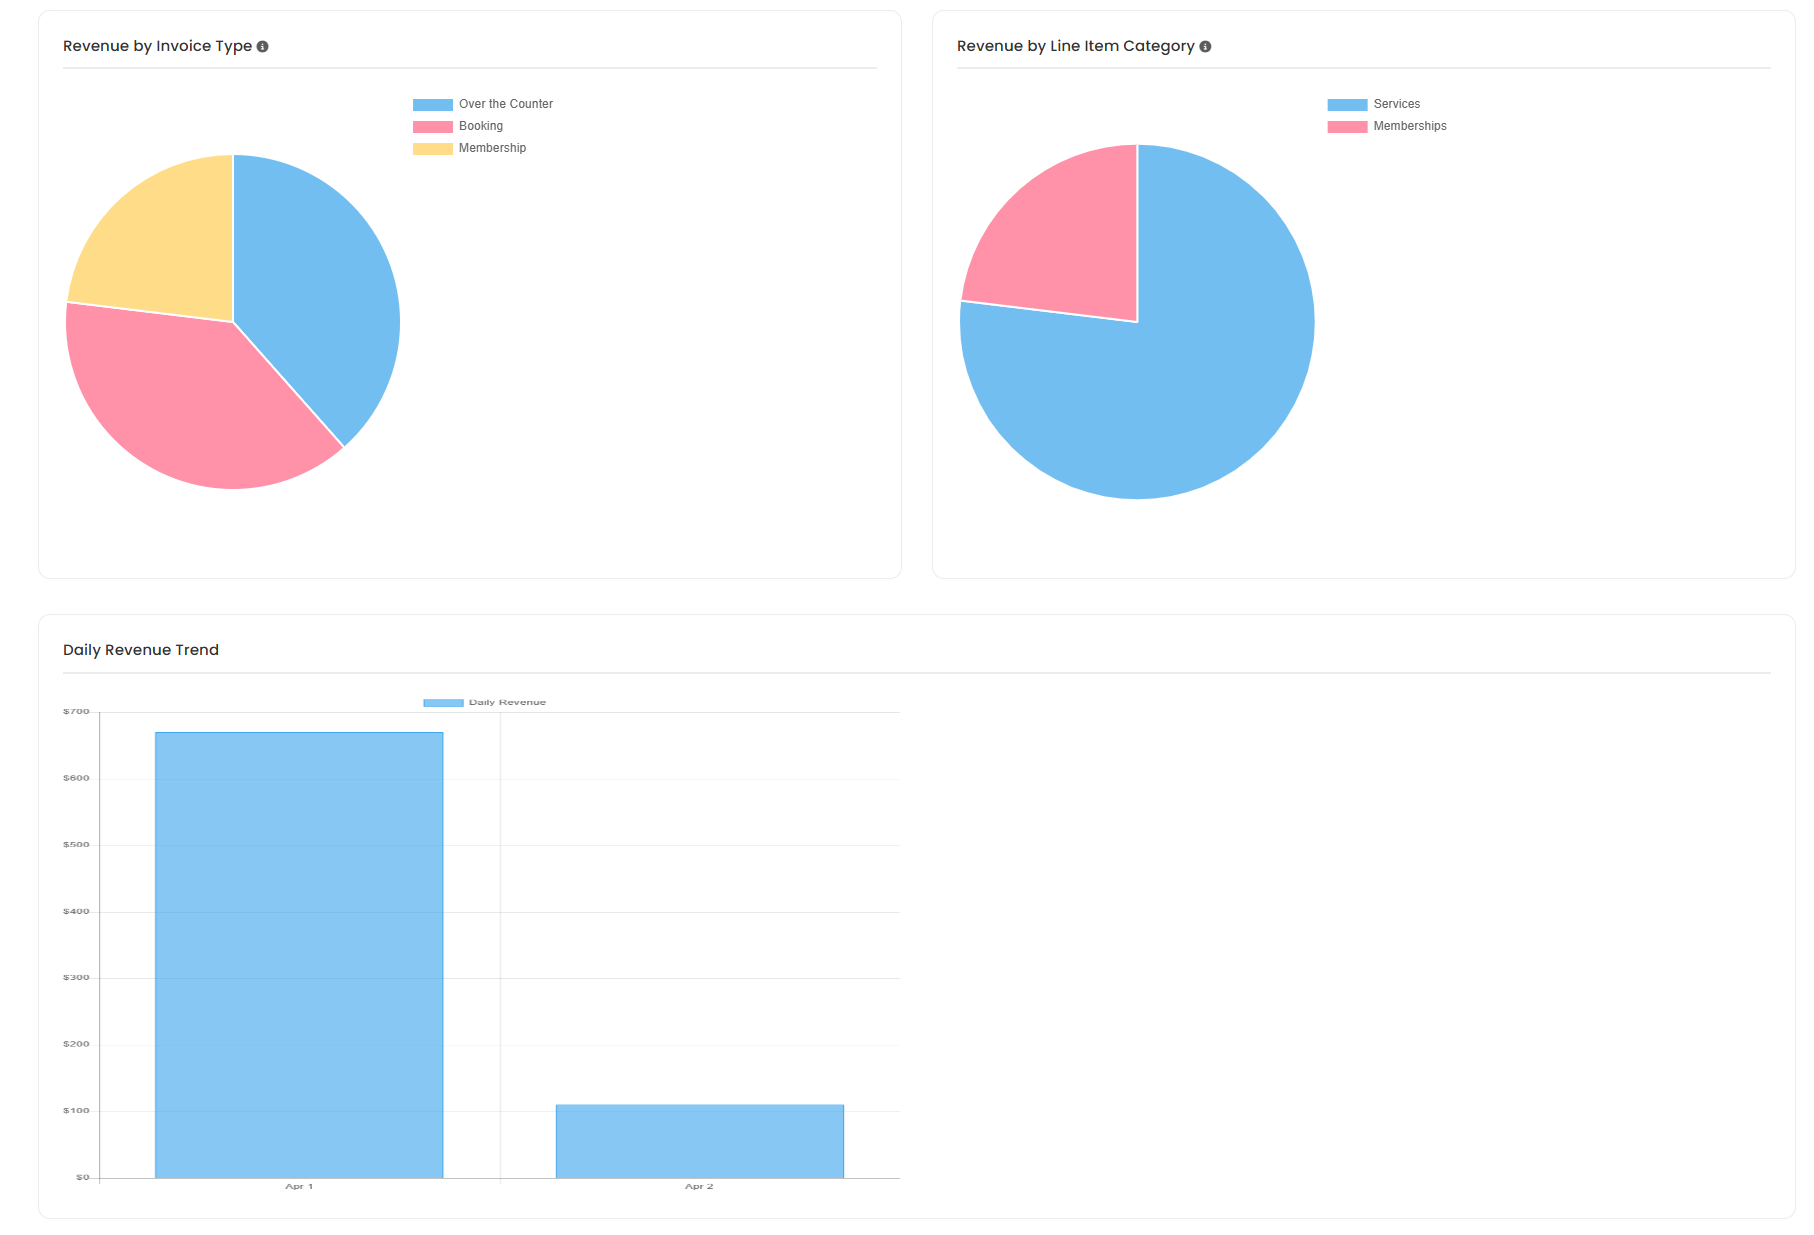 Note: “Revenue by Invoice Type” is the total income categorized by different types of invoices, such as products, services, or packages. “Revenue by Line Item Category” is the total income broken down by specific item or service categories within invoices. “Daily Revenue Trend” is a record or graph showing revenue generated each day over a period, used to track performance and identify patterns.
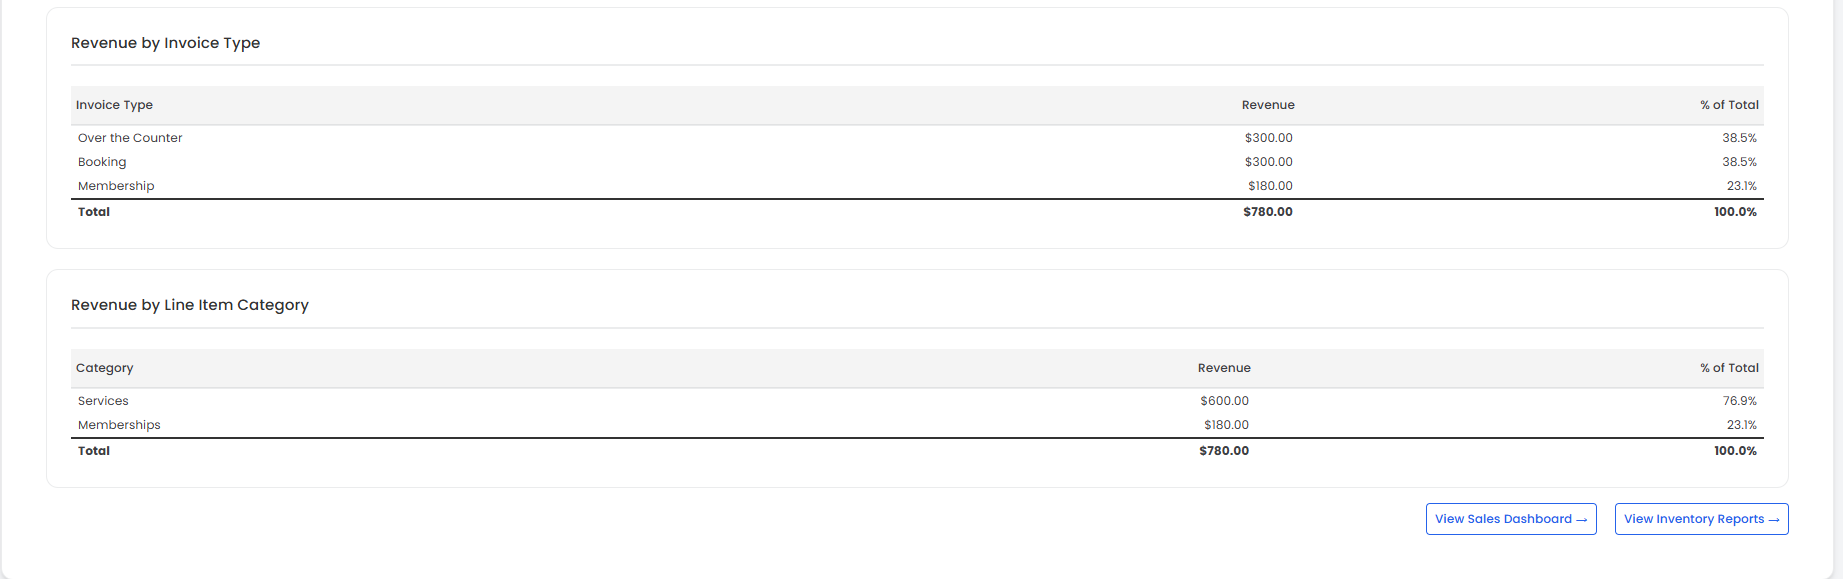
 - Below the graphs, the detailed revenue breakdown shows Revenue by Invoice Type and by Line Item Category, including the amount and percentage of the total revenue.